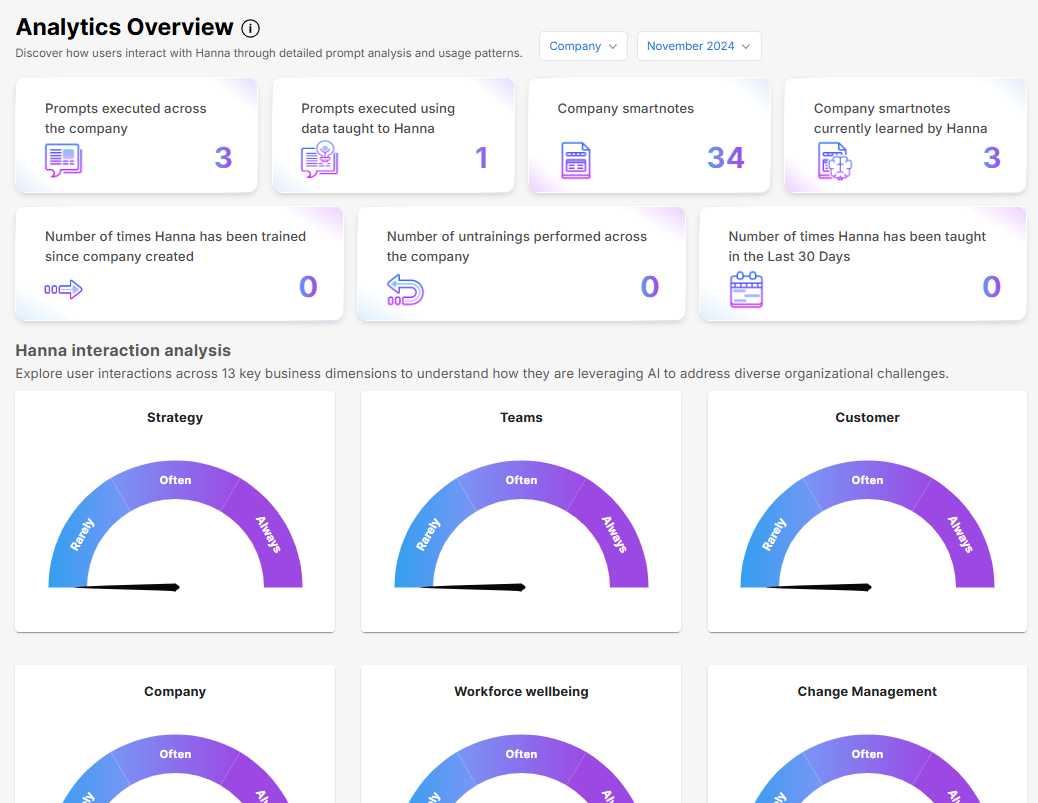
Bienvenido(a) a Hanna Analytics, tu panel integral para entender cómo Hanna está ayudando a tu organización. Hemos diseñado esta poderosa herramienta para brindarte información clara y procesable sobre cómo tus equipos están utilizando Hanna Prodigy para impulsar la innovación, resolver desafíos y transformar tu negocio.

Por qué importan los analytics
En el entorno empresarial acelerado de hoy, entender cómo tu organización interactúa con Hanna no es solo interesante, es esencial para su estrategia. Hanna Analytics le proporciona una imagen clara de qué áreas de su negocio están interactuando activamente con la plataforma de IA, ayudándote a identificar tanto oportunidades como posibles brechas en tu viaje de transformación digital.
Piensa en Hanna Analytics como tu brújula organizacional, señalándote áreas donde la IA está teniendo el mayor impacto y destacando oportunidades para un mayor compromiso. Ya seas un CEO que busca entender el impacto más amplio de la adopción de IA, un ejecutivo que rastrea el rendimiento departamental, o un líder de cambio guiando la transformación digital, estas analíticas proporcionan los conocimientos que necesitas para tomar decisiones informadas.
Lo que medimos y por qué es importante
Hemos diseñado cuidadosamente nuestras analíticas para rastrear 13 indicadores clave del negocio, desde estrategia e innovación hasta dinámicas de equipo y experiencia del cliente. En lugar de abrumarte con datos complejos, presentamos esta información a través de medidores intuitivos que muestran la frecuencia de uso, que varía de "raramente" a "siempre", facilitando la identificación de tendencias y patrones de un vistazo.
Además, rastreamos siete métricas vitales que te muestran cuán profundamente Hanna se está integrando en tu organización:
- Con qué frecuencia los equipos están interactuando con Hanna
- Con qué frecuencia se está utilizando el conocimiento único de tu organización
- Cuánto están contribuyendo tus equipos a la base de conocimientos de Hanna
- Actividad de entrenamientos en los últimos 30 días
- y más...
Acceso fácil y flexibilidad
Entendemos que diferentes roles necesitan distintas vistas de los datos. Por eso hemos hecho que sea simple cambiar entre vistas a nivel de empresa y conocimientos específicos de iniciativas. Ya sea que quieras ver cómo está progresando toda tu organización o enfocarte en equipos específicos, la información está a solo un clic de distancia.
Entendiendo tus indicadores de medidor: Raramente, Con frecuencia, y Siempre
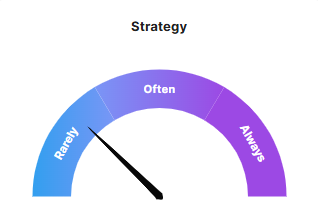
Cuando mire cualquiera de los 13 indicadores en Hanna Analytics, verá un medidor con tres zonas: Raramente, Con frecuencia y Siempre. Estos no son solo mediciones, son percepciones sobre cómo su organización está involucrando a Hanna con diferentes aspectos del negocio.

Entendamos qué significa cada nivel y qué podría decirte sobre tu organización.
- Raramente (Zona Izquierda): Cuando un indicador muestra "Raramente", significa que esta área recibe atención limitada en las interacciones de IA. Esto no es necesariamente negativo; podría simplemente reflejar tus prioridades actuales o el ciclo de negocio. Por ejemplo, si tu indicador de Gestión de Riesgos muestra "Raramente" durante un período estable, esto podría ser perfectamente normal. Sin embargo, si tu indicador de Clientes está en la zona de "Raramente" mientras lanzas una importante iniciativa de experiencia del cliente, esto podría señalar una desconexión que necesita atención.
- Con frecuencia (Zona media): Indica un compromiso saludable y regular con este aspecto de su negocio a través de la IA. Este es típicamente donde muchos indicadores se ubicarán en una organización bien equilibrada. Muestra que los equipos están incorporando activamente la IA en su trabajo en esta área, pero puede que no la necesiten constantemente. Por ejemplo, ver "Con frecuencia" en Innovación podría indicar que los equipos están explorando regularmente nuevas ideas y posibilidades, manteniendo un flujo constante de pensamiento creativo sin abrumar sus responsabilidades principales.
- Siempre (Zona Derecha): Cuando un indicador alcanza "Siempre," muestra que esta área es un enfoque principal de las interacciones de IA en su organización. Esto podría indicar una prioridad estratégica o un esfuerzo de transformación en curso. Por ejemplo, si su indicador de Tecnología está en la zona de "Siempre" durante un proyecto de transformación digital, esto se alinea perfectamente con los objetivos de su organización.
Ejemplos y Acciones del Mundo Real
Ejemplo 1: Impacto de la comunicación estratégica
Imagina que acabas de dar una presentación convincente sobre los nuevos objetivos estratégicos para el año. En las semanas siguientes, notas que el indicador de Estrategia se mueve de "Con frecuencia" a "Siempre". Esta es una señal poderosa de que tu mensaje ha resonado: los equipos están participando activamente con Hanna para entender e implementar la nueva estrategia. Este aumento en las consultas relacionadas con la estrategia sugiere que tu organización está trabajando activamente para alinearse con la nueva dirección.
Acciones posibles:
- Programar sesiones de seguimiento con equipos que muestran un alto compromiso estratégico
- Comparta historias de éxito sobre cómo los equipos están utilizando la IA para implementar la estrategia
- Identificar equipos con menor compromiso para apoyo y orientación adicional
Ejemplo 2: Gestión del Cambio Durante la Reorganización
Durante una reestructuración organizativa importante, ver la gestión del cambio en "Siempre" mientras que los equipos y la estrategia permanecen en "Con frecuencia" sugiere que su organización está utilizando activamente la IA para navegar la transición mientras mantiene operaciones regulares.
Acciones posibles:
- Crea canales dedicados para compartir las mejores prácticas de gestión del cambio
- Organiza talleres interfuncionales para abordar desafíos comunes
- Monitorea los indicadores de bienestar de los empleados durante la transición
Ejemplo 3: Enfoque en la Experiencia del Cliente
Una empresa que prioriza la experiencia del cliente podría ver a Clientes en "Siempre", con Innovación y Operaciones en "Con frecuencia". Este patrón muestra una fuerte alineación entre el uso de IA y los objetivos centrados en el cliente.
Acciones posibles:
- Comparta información sobre los clientes entre departamentos
- Desarrollar iniciativas de servicio al cliente impulsadas por IA
- Crear equipos de experiencia del cliente interfuncionales
Recuerda: El objetivo no es tener todo en la zona de "Siempre". Una organización saludable típicamente mostrará una mezcla de niveles que reflejan sus prioridades y desafíos actuales. Cuando vea que los indicadores cambian, considérelo una invitación a explorar más a fondo:
- ¿Qué provocó el cambio?
- ¿Está este cambio alineado con tus objetivos actuales?
- ¿Qué apoyo podrían necesitar los equipos para tener éxito?
Estos indicadores sirven como un bucle de retroalimentación dinámico, ayudándote a entender cómo tu organización está respondiendo a las iniciativas de liderazgo, cambios en el mercado y prioridades estratégicas. Úsalos como iniciadores de conversación con tus equipos, y deja que guíen tu toma de decisiones sobre la asignación de recursos, estrategias de comunicación y enfoque organizacional.
El poder de estos indicadores radica no solo en las mediciones en sí, sino en las historias que cuentan sobre el viaje de su organización y las oportunidades que revelan para un mayor impacto y compromiso.
Privacidad y Rendimiento
Sabemos que podrías estar preocupado por la recolección de datos que impacta el rendimiento del sistema o la privacidad. Nuestro sistema de analíticas funciona sin problemas en segundo plano sin afectar el tiempo de respuesta o el rendimiento de Hanna. Lo hemos diseñado para que sea ligero pero completo, asegurando que obtengas todos los conocimientos que necesitas sin inconvenientes.
Comenzando
Para comenzar a explorar sus análisis, simplemente haga clic en Hanna Analytics en el panel y use los menús desplegables en la parte superior para seleccionar su vista deseada (Empresa o iniciativa específica) y el mes que le gustaría analizar. Los medidores y métricas se actualizarán automáticamente para reflejar su selección, brindándole información instantánea sobre los patrones y tendencias de uso de la IA.
Recuerda, estas analíticas no son solo números; son historias sobre cómo tu organización está evolucionando en la era de la IA Estratégica. Te ayudan a celebrar éxitos, identificar áreas de crecimiento y tomar decisiones informadas sobre tu estrategia de IA en el futuro.