Hanna Prodigy Visual Architect is a sophisticated tool designed to transform your ideas into visual reality. Whether you're a product owner, business analyst, or any professional needing to quickly prototype user interfaces or create data visualizations like charts, Hanna Prodigy is your go-to solution.
UX Prototyping with Hanna
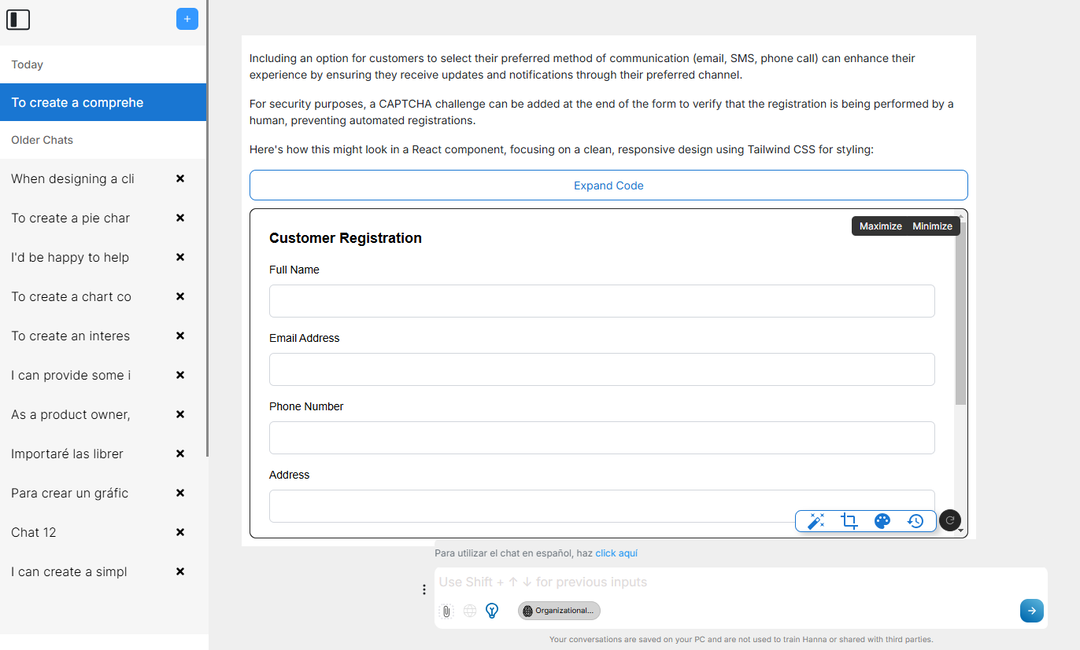
The Visual Architect feature allows you to create functional UI prototypes through simple natural language prompts. Simply describe the UX or chart you need, and Hanna will generate an interactive prototype instantly.
Example Prompt: "Create a screen for customer registration with fields that are usually needed in order to capture several details of a client"

Response: Hanna will generate a functional form interface with:
- Properly formatted input fields
- Validation rules
- Submit button
- Professional layout and spacing
- Responsive design elements
Creating Responsive Tables with Hanna
Hanna's table creation capabilities bring your data to life with fully functional, interactive tables that do more than just display information. Let me show you how this powerful feature works!

Simply describe the table you need in natural language, and Hanna will create a responsive table with all the bells and whistles. For example, try saying "Create a table for managing employee information with columns for ID, name, age, and actions."
Smart Features might include different functionalities according to your prompt. You will create responsive design that looks great on any screen size! Best of all, these tables are more than just pretty—they're practical tools that can be used for prototyping, data management interfaces, or even as working components in your applications. And like everything else in Hanna Prodigy, you can customize them using the Advanced toolbar described below.
Creating Charts with Hanna
The ability to transform raw numbers into compelling visual narratives is invaluable. Hanna Prodigy Visual Architect excels in this domain, offering a sophisticated suite of visualization tools that can bring your data to life. Let's explore how Hanna can help you tell your data stories effectively.

Hanna can create dozens of highly visual graphics that are also dynamic. By hovering the mouse pointer over the top, data and values are displayed.
In turn, you can share these graphs with others using Smartnotes or even teach Hanna with your graphs or other interfaces.
Advanced Toolbar: Enhancing Your Visualization Experience
Let's explore the magical set of tools that appear beneath your visualizations in Hanna Prodigy—each designed to make your creative process smooth and enjoyable!

Magic Wand
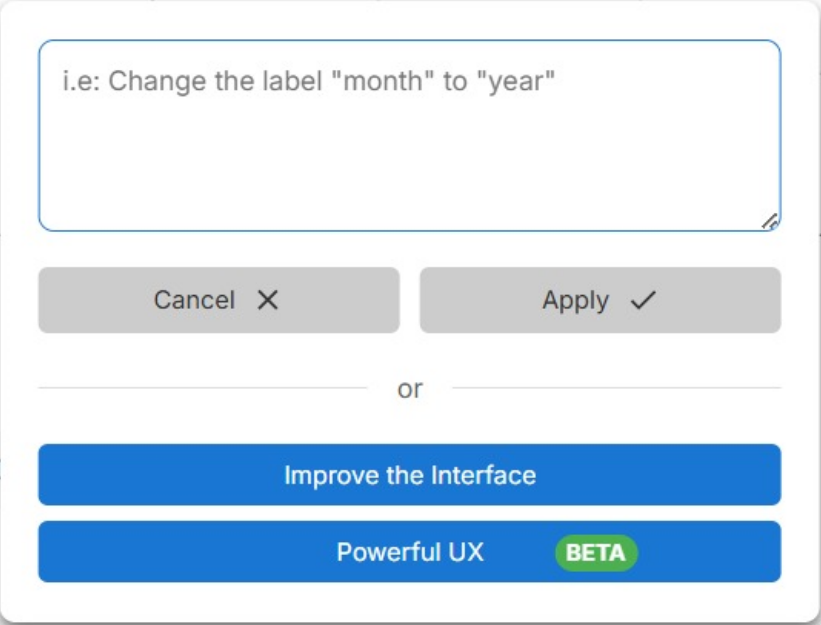
This option will help you enhance and perfect your creations. When clicked, it opens a window where you can type in your improvements—whether you want to tweak labels, adjust styles, or completely reimagine your design. Plus, it houses some special powers like the Powerful UX feature (in beta) that can turn your basic prototypes into stunning interfaces!
Snapshot Tool
Next up is your sharing companion—the snapshot tool. With just one click, you can capture your creation and share it with teammates or stakeholders or even add it to any of our boards.
Color Magic
Want to match your company's colors? This tool lets you play with colors until your visualization looks just right.
Time Machine
Sometimes we all wish we could turn back time—and with the rollback button, you can! This feature lets you jump back to previous versions of your work.
Smart Self-Healing
Hanna Prodigy is clever—if something doesn't work quite right the first time, it'll automatically try to fix itself and give you an improved version. If that doesn't work, you can always use the advanced options below.
Advanced Options Window
When you click on the magic wand, you'll see a new window with advanced options.

Here you can:
Textbox: Write your visualization improvements in the textbox above, for example, replace months by weeks.
Improve Interface: Click here to ask Hanna to find possible improvements and re-generate your creation (you can also use it if your UX or Chart gets and error)
Powerful UX: Try out our Powerful UX feature (in BETA) that adds professional polish to your UXs. This is useful when creating interfaces or mock screens for your apps but won't have any effects on charts. Remember, as it is BETA it might fail.
Remember, Hanna Prodigy loves to learn and grow with you! Every time you create something new or make improvements, you can add it to a smartnote and share it with others or train Hanna with it.
Check out the next topic below, to learn more about the different types of charts Hanna can create and examples of different prompts you can use.
(*) Soon you will have the possibility to upload CSV or Excell files; in the meantime, you can describe your data in the query.